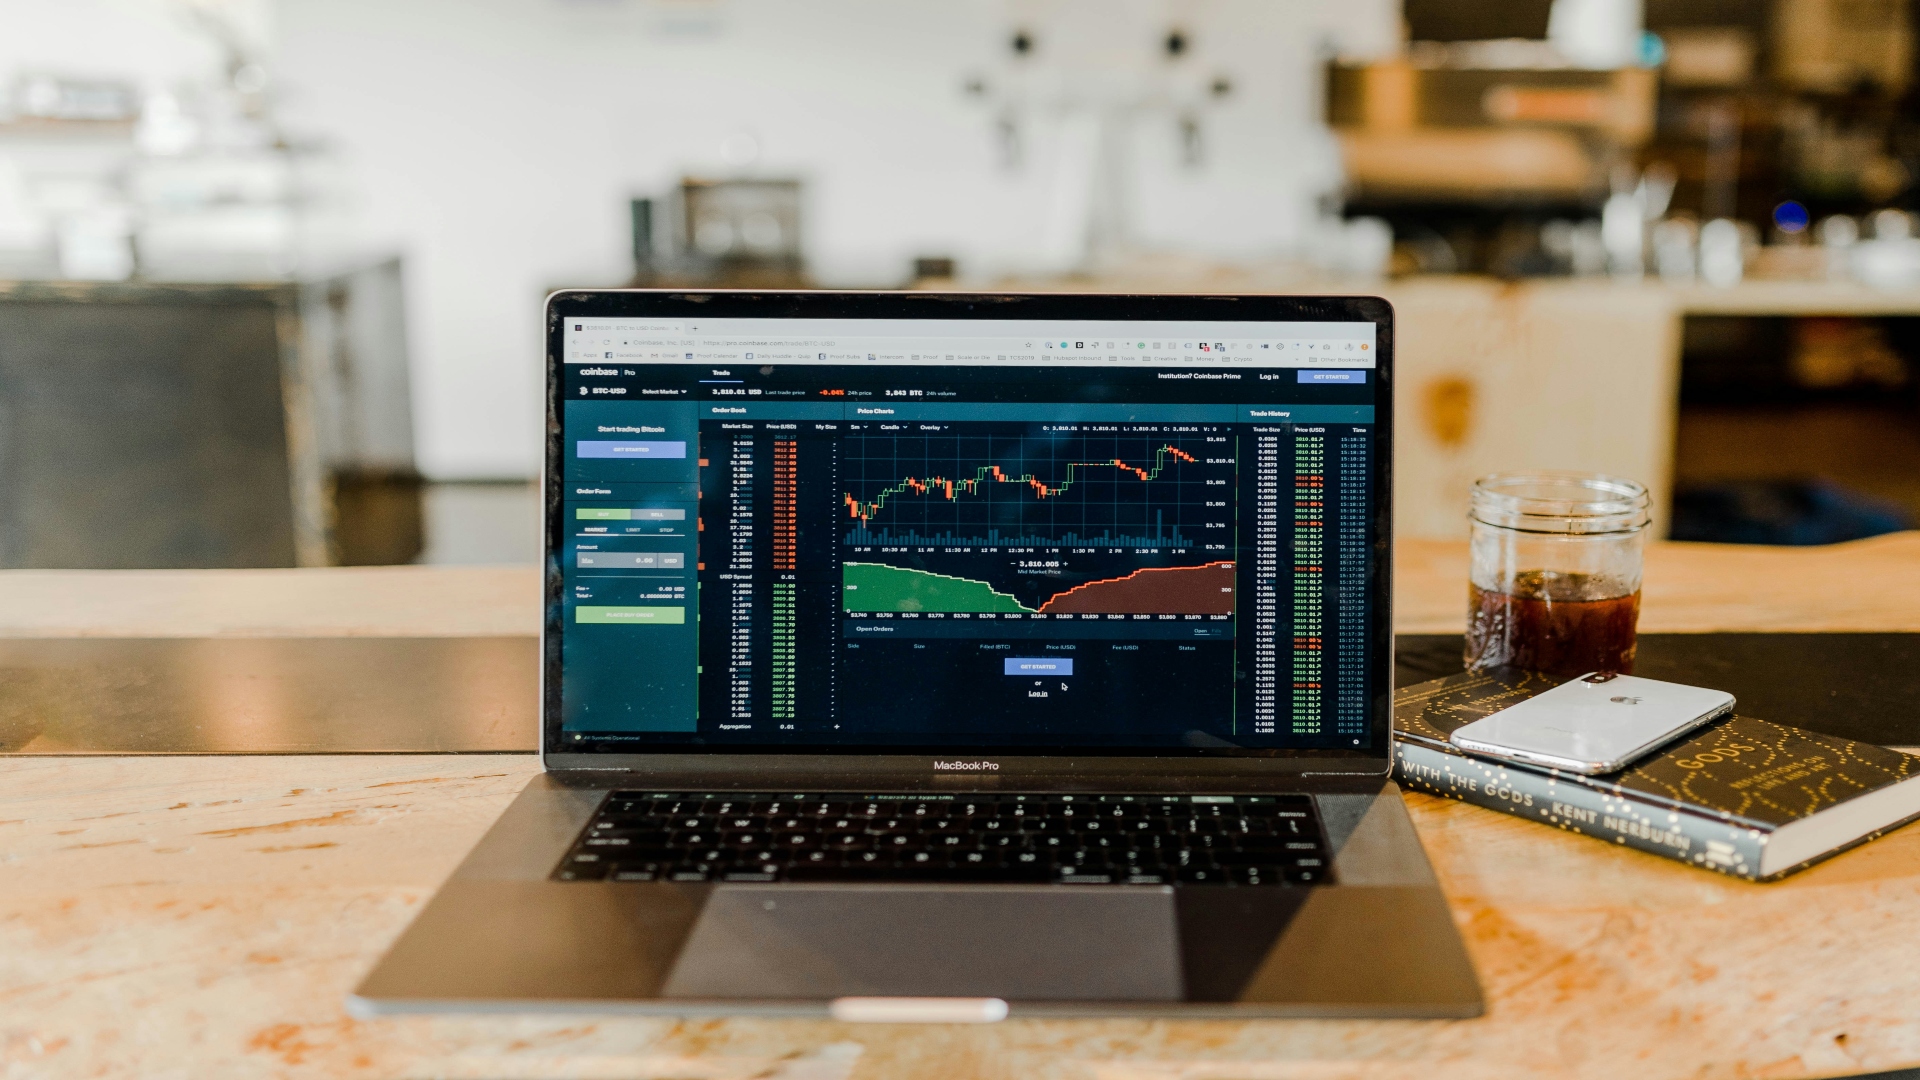
How to improve your trading strategy with chart patterns and technical analysis

As trading has become more complex, traders must use different strategies and tools to avoid risks and capitalise on opportunities. The trading ecosystem benefits from advanced solutions that allow users to stay updated with the fast-paced system influenced by trends, inflation, and policies.
Chart patterns are one of the best instruments for trading. They are considerably reliable and can effectively predict price movements. Reading chart patterns requires a bit of experience, as you must understand entry and exit points and know where to set stop losses.
However, chart patterns can be more productive when paired with other trading indicators, such as technical analysis standards, kike the RSI (Relative Strength Index) movement. So, if you want to upgrade your trading strategy, here’s what to consider along with chart patterns.
Why are chart patterns important?
All trading strategies include chart patterns because they help traders analyse and understand the market. These visual representations of price movements are categorised into numerous patterns, whether ascending or descending, and they tell an important story when paired with previous charts.
Some of the most important chart patterns include the following:
- The ascending triangle includes a horizontal resistance line and a rising support line that showcase prices will be pushed higher by aggressive buyers;
- The double bottom chart represents a price hitting the support level twice and reaching a moderate pullback amid these two, revealing a reversing downtrend, soon to be uptrend;
- The triple-top chart pattern happens after three peaks that showcase the end of the uptrend and the beginning of a downtrend;
There are numerous variations of chart patterns, candlesticks, and similar indexes you must learn and identify. As you gain more experience in trading and reading these signs, you’ll be able to improve your trading strategy and add other essential factors like technical indicators.
What is technical analysis?
Technical analysis leverages historical price charts and market statistics, as well as momentum indicators, oscillators, and moving averages. Therefore, it includes indicators experts can calculate and apply mathematical formulas to prices and volumes.
Several technical indicators apply for:
- On-balance volume. Traders use it to identify an asset’s positive and negative flow of volume to check whether intense buying pressure follows or there’s a potential reversal coming up;
- Average directional index. This indicator measures the strength and momentum of a trend that offers the opportunity to trade based on an actual trend;
- The Aroon indicator. This is an oscillator that offers insight into the beginning of new trends and the end of older ones based on time factors;
Therefore, technical analysis provides traders with the basic information they require before making a decision based solely on reading the charts. Historical prices always offer valuable data, but upcoming trends can change the course of an asset’s opportunities, which is why these two solutions must be used together.
How do you blend chart patterns with technical indicators?
While it may be challenging to consider both functions when trading, traders need confirmation of a trend to ensure they’re not making a decision based on FOMO (fear of missing out). For example, you can confirm chart patterns with technical indicators by checking indicators that support a specific pattern, such as the Relative Strength Index (RSI) for a head and shoulders chart.
You can also identify trend strengths with technical analysis to greenlight a trade or not. The Moving Average Convergence Divergence (MACD) can determine if a bullish trend is here for the long term, confirming your next step.
Finally, you can upgrade your entry and exit strategy by combining the two indicators. A bullish trend accompanied by the cup and handle chart pattern might give you mixed feelings, but checking the Stochastic Oscillator will offer enough clarity on the market’s condition to enter the trade when it is most profitable.
Other indicator categories to remember
Trading can get complicated if you’re missing out on the usefulness of indicators, which is why you must be wary of these trading categories and indicators. First, those showcasing momentum include:
- The Relative Strength Index (RSI) measures the speed at which a security changes price;
- The Commodity Channel Index (CCI) takes in the current market price level relative to the average level to identify uptrends and downtrends;
- The Stochastic indicator supports understanding trend dynamics and chart reading;
If trends are what you’re looking for, check out:
- The Average Directional Index (ADX) reveals a security’s strength of maintaining a trending price;
- The Moving Average convergence/divergence (MACD) helps identify entry points for buying or selling;
- The parabolic stop and reversal system (SAR) determines a trend direction or potential reversal;
On volume patterns and trading signals
Volume is also an important insight into market sentiment, and traders prioritise it as it strengthens pattern-based charts. The volume indicator can confirm and anticipate changes in price in different trending markets.
For example, short-term trading volume leads to trend confirmation when the rising prices and volume showcase an uptrend, but this can also happen when falling prices and rising volume lead to a downtrend. On the other hand, trend weakness is seen through increasing prices and falling volumes that signal weakness.
You can leverage volume as:
- High-volume breakouts that show strong market support backed by a pattern that breaks out on high volume. As the volume increases, traders are more specific about the breakout, confirming there are fewer chances of false entries;
- Volume Price Trend (VPT) that identifies whether buyers or sellers rule the market. If price patterns align with the indicator, traders have a clearer image of establishing their entry or exit strategies;
Have you combined chart patterns with technical analysis yet?
Chart patterns are some of the most important indicators in trading, offering valuable information about price movements and trends. However, they have limitations, which is why backing them with technical analysis is ideal for building a successful strategy. Indicators showing momentum, trends, or volume are needed to confirm whether chart patterns are accurate enough for traders to act.
The post How to improve your trading strategy with chart patterns and technical analysis appeared first on EU Business News.


